使用浏览器诊断 JavaScript 错误
概述
本文档指导 WordPress 开发者如何利用浏览器工具诊断 JavaScript 错误或冲突,以解决交互功能问题,如菜单、元框或媒体按钮失效。通过分步流程,帮助开发者定位错误并有效提交支持请求。
关键要点
- JavaScript 错误可能导致交互功能中断,如 flyout menus、metaboxes 或 add media buttons 无法正常工作。
- 诊断步骤包括:尝试不同浏览器以排除浏览器特定错误、启用 SCRIPT_DEBUG 调试、使用浏览器开发者工具识别错误,并收集信息以报告问题。
- 在支持请求中,需提供浏览器信息、SCRIPT_DEBUG 状态、JavaScript 错误详情、错误位置(文件名和行号)以及完整错误堆栈上下文。
代码示例
define('SCRIPT_DEBUG', true);注意事项
- 如果 SCRIPT_DEBUG 解决了问题,请关闭它并在支持论坛中报告,说明调试已启用并解决问题。
- 在开发者工具中,确保复制整个错误堆栈信息,而不仅仅是行号,以提供更全面的上下文。
- 如果控制台未显示错误,尝试重新加载页面,因为许多错误仅在页面首次加载时出现。
If you’re experiencing issues with your interactive functionality this may be due to JavaScript errors or conflicts. For example, your flyout menus may be broken, your metaboxes don’t drag, or your add media buttons aren’t working. In order to formulate your support request it helps the team to know what the JavaScript error is.
This guide will show you how to diagnose JavaScript issues in different browsers.
Step 1: Try Another Browser
Different browsers often implement parts of JavaScript differently. To make sure that this is a JavaScript error, and not a browser error, first of all try opening your site in another browser.
- if the site is not having the same issue in the new browser you know that the error is browser specific
- if the site is having the same error it is not an error that is specific to one browser
Make note of any browsers you are experiencing the error in. You can use this information when you are making a support request.
Step 2: Enable SCRIPT_DEBUG
You need to turn on script debugging. Open wp-config.php and add the following line before “That’s all, stop editing! Happy blogging”.
define('SCRIPT_DEBUG', true);
Check to see if you are still having an issue.
- Issue is fixed – turn off script debugging and report the issue on the support forum, telling the volunteers that you turned on script debugging and it solved the problem.
- Issue persists – proceed to Step 3.
Step 3: Diagnosis
Open the Developer Tools
- Chrome: Type
Cmd-Option-J(Mac) orCtrl-Shift-J(Windows, Linux, Chrome OS), or navigate toView -> Developer -> Developer Toolsin the menu. - Firefox: Type
Cmd-Option-K(Mac) orCtrl-Shift-K(Windows, Linux, Chrome OS), or navigate toWeb Development -> Web Consolein the menu. - Edge: Follow the instructions for Chrome.
- Safari: First, navigate to
Safari -> Preferences. Click on theAdvancedtab, then checkShow Develop Menu in menu bar. Then, in the newDevelopmenu, navigate toShow JavaScript Console. - Opera: Navigate to
Tools -> Advanced -> Error Consolein the menu.
Identify The Error
Often, the text of the error will already be visible in the console. It may look similar to this:
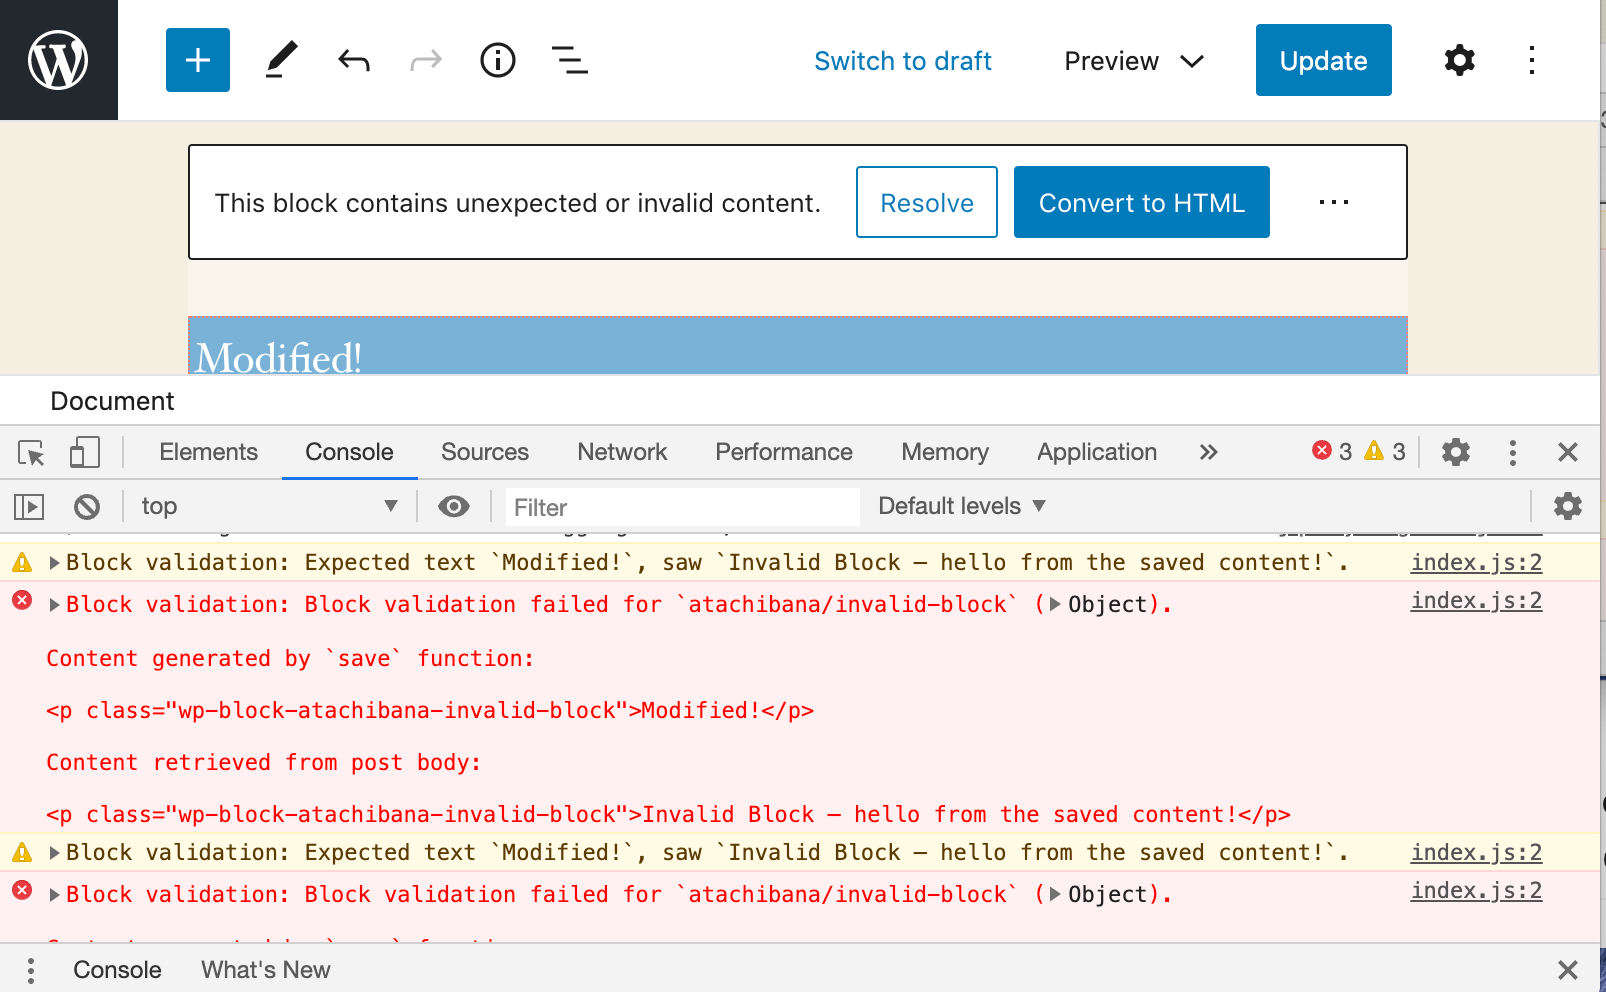
The image above shows the error to be in jquery.js on line 2, however remember to copy the whole stack information! Just saying what line is less helpful that showing context.
If no errors are displayed, reload the page; many errors occur only when the page is first loaded.
Step 4: Reporting
Now that you have diagnosed your error, you should make your support forum request. Go to the troubleshooting forum.
If your problem is with a specific theme or plugin, you can access their dedicated support forum by visiting https://wordpress.org/support/plugin/PLUGINNAME or https://wordpress.org/support/theme/THEMENAME.
Please include the below information:
- the browsers that you are experiencing the problem in
- whether
SCRIPT_DEBUGfixed the error or not - the JavaScript error
- the location of the error – both the file name and the line number
- the context of the error – including the whole error stack will help developers
- If possible, a link to the web page showing the error